Explore the process of creating a simple scatter plot using D3 js in this guided project. Covering data loading, linear and ordinal scaling, and more, you'll learn valuable techniques for data visualization.
Certificate Available ✔
Get Started / More Info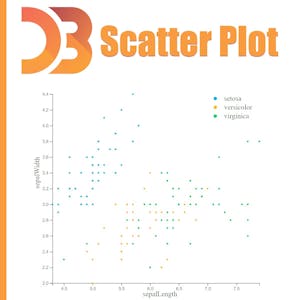
Data Science con Python e R è una specializzazione che ti prepara a utilizzare Python e R per risolvere problemi di Data Science. Impara le basi della programmazione,...
Dive into the world of data visualization and storytelling with the "Daten über Visualisierungen teilen" course, designed to equip you with essential...
Learn to apply PySpark and Machine Learning to healthcare projects in this practical and effective course. Gain skills in PySpark fundamentals, model training and...
This course provides an introduction to essential tools and concepts for data scientists. Students will learn to set up R, R-Studio, GitHub, and other useful tools,...