In this project, you will delve into the world of bioinformatics and medical research by creating an interactive three-dimensional (3D) representation of SARS-CoV-19 protein structures using Biopython. The course will equip you with the skills to manipulate biological sequence data, query biological databases, and understand SARS-CoV-19 genome properties. Through hands-on experience, you will gain a deeper understanding of the tasks performed by bioinformaticians and the up-to-date concepts and database use cases in the field of medical research and human genetics.
Key learning points include biological sequence and data manipulation with Biopython, querying biological databases using Biopython and web-scraping, and creating an interactive 3D model of the SARS-CoV-19 protein. Additionally, you will learn about important databases used by biologists and biotechnologists, as well as the types of sequence data accessible and visualizable from these databases using Biopython and Jupyter notebook.
Certificate Available ✔
Get Started / More Info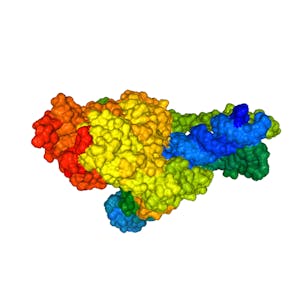
Data Science at Scale is a comprehensive specialization covering scalable data management, big data technologies, and effective data visualization.
Dive into the world of data analysis with Google's Daten Analysieren, um Fragen zu Beantworten. Gain hands-on experience in organizing, formatting, aggregating,...
Linear Regression for Business Statistics teaches you to apply various procedures in Microsoft Excel. Learn to build, estimate, and interpret linear regression models...
Tableau를 사용한 대시보드 및 스토리텔링 작성 과정은 데이터 시각화와 스토리텔링에 중점을 두고 있습니다.